The lockdowns under the COVID-19 pandemic have provided much opportunity for the time-constrained human inhabitant of mother earth to gaze at the empty streets and retrospect life under the so-called normal life – hazy streets packed with humans chasing dreams, traffic jam, thick smokes oozing out of factories, sounds of sirens, hovering helicopters and trails left behind in the sky by passing airplanes. Many have even wondered if the pandemic is Nature’s brake on speeding humanity to nowhere. Some have wondered if normal life should be different – a bit less of everything we see around ourselves. I have wondered about the amount of energy that goes into sustaining this normal human life – the generally not so clean energy that is driving climate change. Thinking about the slow pace of global efforts to combat climate change through emission reductions, switching to cleaner energy sources, one would even wonder if restrained human activity would be the ultimate solution to addressing climate change as the single-most threat to life on earth.
With the above disposition in mind, this article dwells on the subject of energy demand and consumption under restrained human activity during the COVID lock downs. In this case, we look at Bhutan in terms of its energy demand and consumption before, during, and after lockdowns.
Energy DemandAbout 40% of the country’s energy consumption today is met through electricity, mainly via hydropower plants. Other energy demand is met mostly through fuelwood (traditional biomass), which adds to pressure on the environment, and imported fossil fuels. With rapid economic growth, urbanization and growth in the population, the demand for clean energy is increasing every year.As per the series of Bhutan Living Standard Surveys (BLSS) conducted by National Statistics Bureau, there was rapid increase in the demand/usage of clean energy mainly electricity by both urban and rural households. The BLSS is nation-wide household survey conducted every after 5 years. The change in trend is shown in the table 1.1.
Table 1.1: Proportion of Households using Different Sources of Energy for Lighting and Cooking 2007, 2012 and 2017

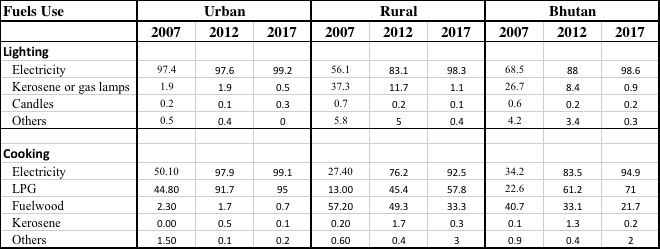
Note: For 2012 and 2017 BLSS, the households were asked to report two main sources of energy used for cooking, thus, the total percentage may be more than 100 since most households use multiple sources of energy for cooking.
Energy Production Energy production is defined as the total amount of primary energy produced in the Bhutanese economy measured before consumption and transformation. Domestic energy production in Bhutan includes renewable energies, hydroelectricity and coal. The domestic energy production has increased in 2020 to little more than 1000 KToE from 903 KToE in 2019. The increase in energy production was mainly due to the full commissioning of 720 MW Mangdechhu hydro power plant which started commission in June 2019. The production of renewable energy is further expected to increase in Bhutan with commissioning of 180 KW (installed capacity) solar energy in October 2021 and upcoming hydropower plants.Bhutan imports various energy products, such as fossil fuel (diesel & petrol), aviation turbine fuel, kerosene, furnace oil and LPG. In 2020, Bhutan imported nearly 140 KToE of fossil fuel energy without including electricity and coal. Bhutan mainly exports hydro-electricity and coal to rest of the world (RoW) where Hydro-electricity remains major export with almost 85-97% of the total energy export.
Energy ConsumptionEnergy consumption measures the amount of energy used in the Bhutanese economy. It is equal to indigenous production plus imports minus exports (and changes in stocks). It includes energy consumed in energy conversion activities (such as electricity generation). Although, the domestic energy production has increased by little more than 100 KToE from 2019 to 2020, there was drop in the energy consumption. The overall import of energy decreased by almost 36% in 2020 compared to 2019. The Diesel and Petrol is most widely imported fossil fuels in the country as there is no domestic production. These fossil fuels are mostly used in Transport Sector.
Fossil FuelsThe import of fossil fuel has dropped drastically in 2020. The import of Diesel has dropped by more than 30 percent in 2020 compared to 2019. In absolute term, Bhutan imported only 109.0 thousand Kiloliters of Diesel in 2020 which is least in last five years (2016-2020). Similarly, the import of Petrol has also dropped by almost 30 percent in 2020 compared to 2019. The trend for import of Diesel and Petrol is shown in the figure 1.1.The reason for drop is mainly because of the Covid pandemic. The first Covid case in the country was detected in March 2020. After detection of first Covid cases, there were two nation-wide lockdowns, first one in August and September 2020 and second one in December 2020 and January 2021. There were several lockdowns happened in border towns of Bhutan which has huge impact on the Economic Activities in the country. There was direct effect on Transport sector as the border for tourism remained closed due to Covid pandemic. Most of the industries also remained shut down.
The Gross Domestic Product (GDP) growth rate has decreased by 10.08 percent in 2020. The drop-in GDP growth rate is mainly contributed by secondary sector (Industry sector) and Tertiary sector (Service sector) with drop of 5.04 and 5.50 percent respectively. There was slight increase in primary sector (Agricultural sector) with 0.47 percent. (National Accounts Statistics 2021, NSB).
Figure 1.1: Import of Fossil Fuels (Diesel and Petrol) in thousand KL and import growth rate in percent 2016-2020
Electricity ConsumptionThe Per capita electricity in the country decreased by almost 15 percent in 2020 compared to 2019 from 3162 KWh to 2708 KWh. While the production of electricity has increased by more than 30 percent from 8647.09 MU in 2019 to 11,370.84 Mu in 2020. The primary and secondary sectors (Industry and Service sectors) are affected more by the Covid pandemic in Bhutan. The electricity consumption by the commercial and industrial sector decreased by more than 300 GWh in 2020 compared to 2019. As shown in the Figure 1.2, in recent last four years, the electricity consumption by the commercial and industrial sector is lowest in 2020. However, there is slight increase in the consumption of electricity by the households.
Figure 1.2: Electricity consumption by Commercial and Industrial sector in GWh, 2017-2020
Monthly Electricity Consumption for 2019 and 2020 Observing the monthly electricity consumption for 2019 and 2020 (Covid-pandemic period), there is no much difference in the electricity consumption for Households and Agriculture sector. However, there is observed significant difference in the electricity consumption for commercial and industrial sector and temporary connections (construction sector). There is huge drop in the consumption of electricity in 2020 compared to 2019. This could be mainly because of covid pandemic as the first covid case in Bhutan is detected in March 2020.
As presented in the figure 1.3, comparing month on month consumption, there is little increase in the electricity consumption in February and March 2020 compared to 2019, however, it started dropping from April onwards in 2020. The highest difference is observed in November 2020. There was 35 percent decrease in the electricity consumption in November 2020 compared to November 2019. In August and September 2020 (First Lockdown period), the consumption has dropped by more than 20 percent compared to the same months in 2019.A similar trend is also observed for the temporary connections that are usually found at the construction and mining sites. It indicates that the covid-pandemic has reduced the construction activities in the country. This could be due to banning the import of construction workers and closure of border gates effecting the import of construction materials.
Figure 1.3 Monthly Electricity Consumption in GWh by Commercial and Industrial Sectors, 2019 & 2020.
Figure1.4 Monthly Electricity Consumption in GWh for Temporary Connections, 2019 & 2020

